Over recent months, I've been slowly working on a little side project to monitor and observe personal habits, ideally to identify improvements. I've called this my Personal Dashboard.
Let's set the context… #
For those who work in tech, dashboards are quite a common concept for highlighting key metrics and trends with charts so we can make informed decisions. As a data junkie and visual person (or an "informatician" as Brian likes to say), I've often enjoyed scrutinising the data, understanding what's happening, having conversations around engaging information.
When I started to analyse my own productivity, health and financial habits, it dawned on me I could create a "personal dashboard" to automatically capture data and visualise in a single central view. I've been manually recording some of this data over the years (such as pension balances across multiple policies and fuel spend); tools like Ticktick and Trello provide simple functionality to track productivity and Strava & MyFitnessPal have provided years of tracking my fitness and weight.
It was through browsing the IFTTT apps I realised it would be quite easy to configure some recipes to sync many of these apps with a Google Sheet so I could analyse the data my own way.
Automating the data #
If you've not used IFTTT before, it's a great tool to hook up Internet of Thing (IoT) devices with online services. The premise is to link triggers with events – if this, then that – and there are endless possibilities as their catalogue of services continue to grow. (I've actually upgraded my account to the IFTTT Pro subscription since they launched as it provides premium services and more versatility over the events).
At the time of writing, IFTTT currently supports the following apps:
- Trello (when an item is moved to a column)
- TickTick (when an item is completed)
- Monzo (when a transaction occurs)
- Twitter (when a tweet is posted)
Where IFTTT fell short was on Strava activities and enhanced RSS parsing with custom data elements in feed descriptions such as Goodreads activity with book specifics. Thankfully, Zapier was able to provide these services so respective "zaps" were configured for these habit trackers.
One of the limitations with Google Sheets IFTTT events is that you can only append data to the first sheet in a worksheet. As I want to visualise all the information in a single dashboard location, I had to get creative with multiple Google Sheet worksheets and the =IMPORTRANGE() function on dedicated sheets to pull in data from other worksheets. It's also worth noting Zapier actually allows you to specify the target sheet within a worksheet.
Whilst Zapier is more versatile with the event configurations, you are limited to 100 events per calendar month on their free plan which can be quickly used up on active feeds. Paid plans start at £15.26/month (at the time of writing) so you need to be heavily invested in this habit tracking solution to feel the value.
Trello data with IFTTT #
Time to demonstrate the configuration of an IFTTT recipe with a dedicated Google Sheet of completed Trello actions.
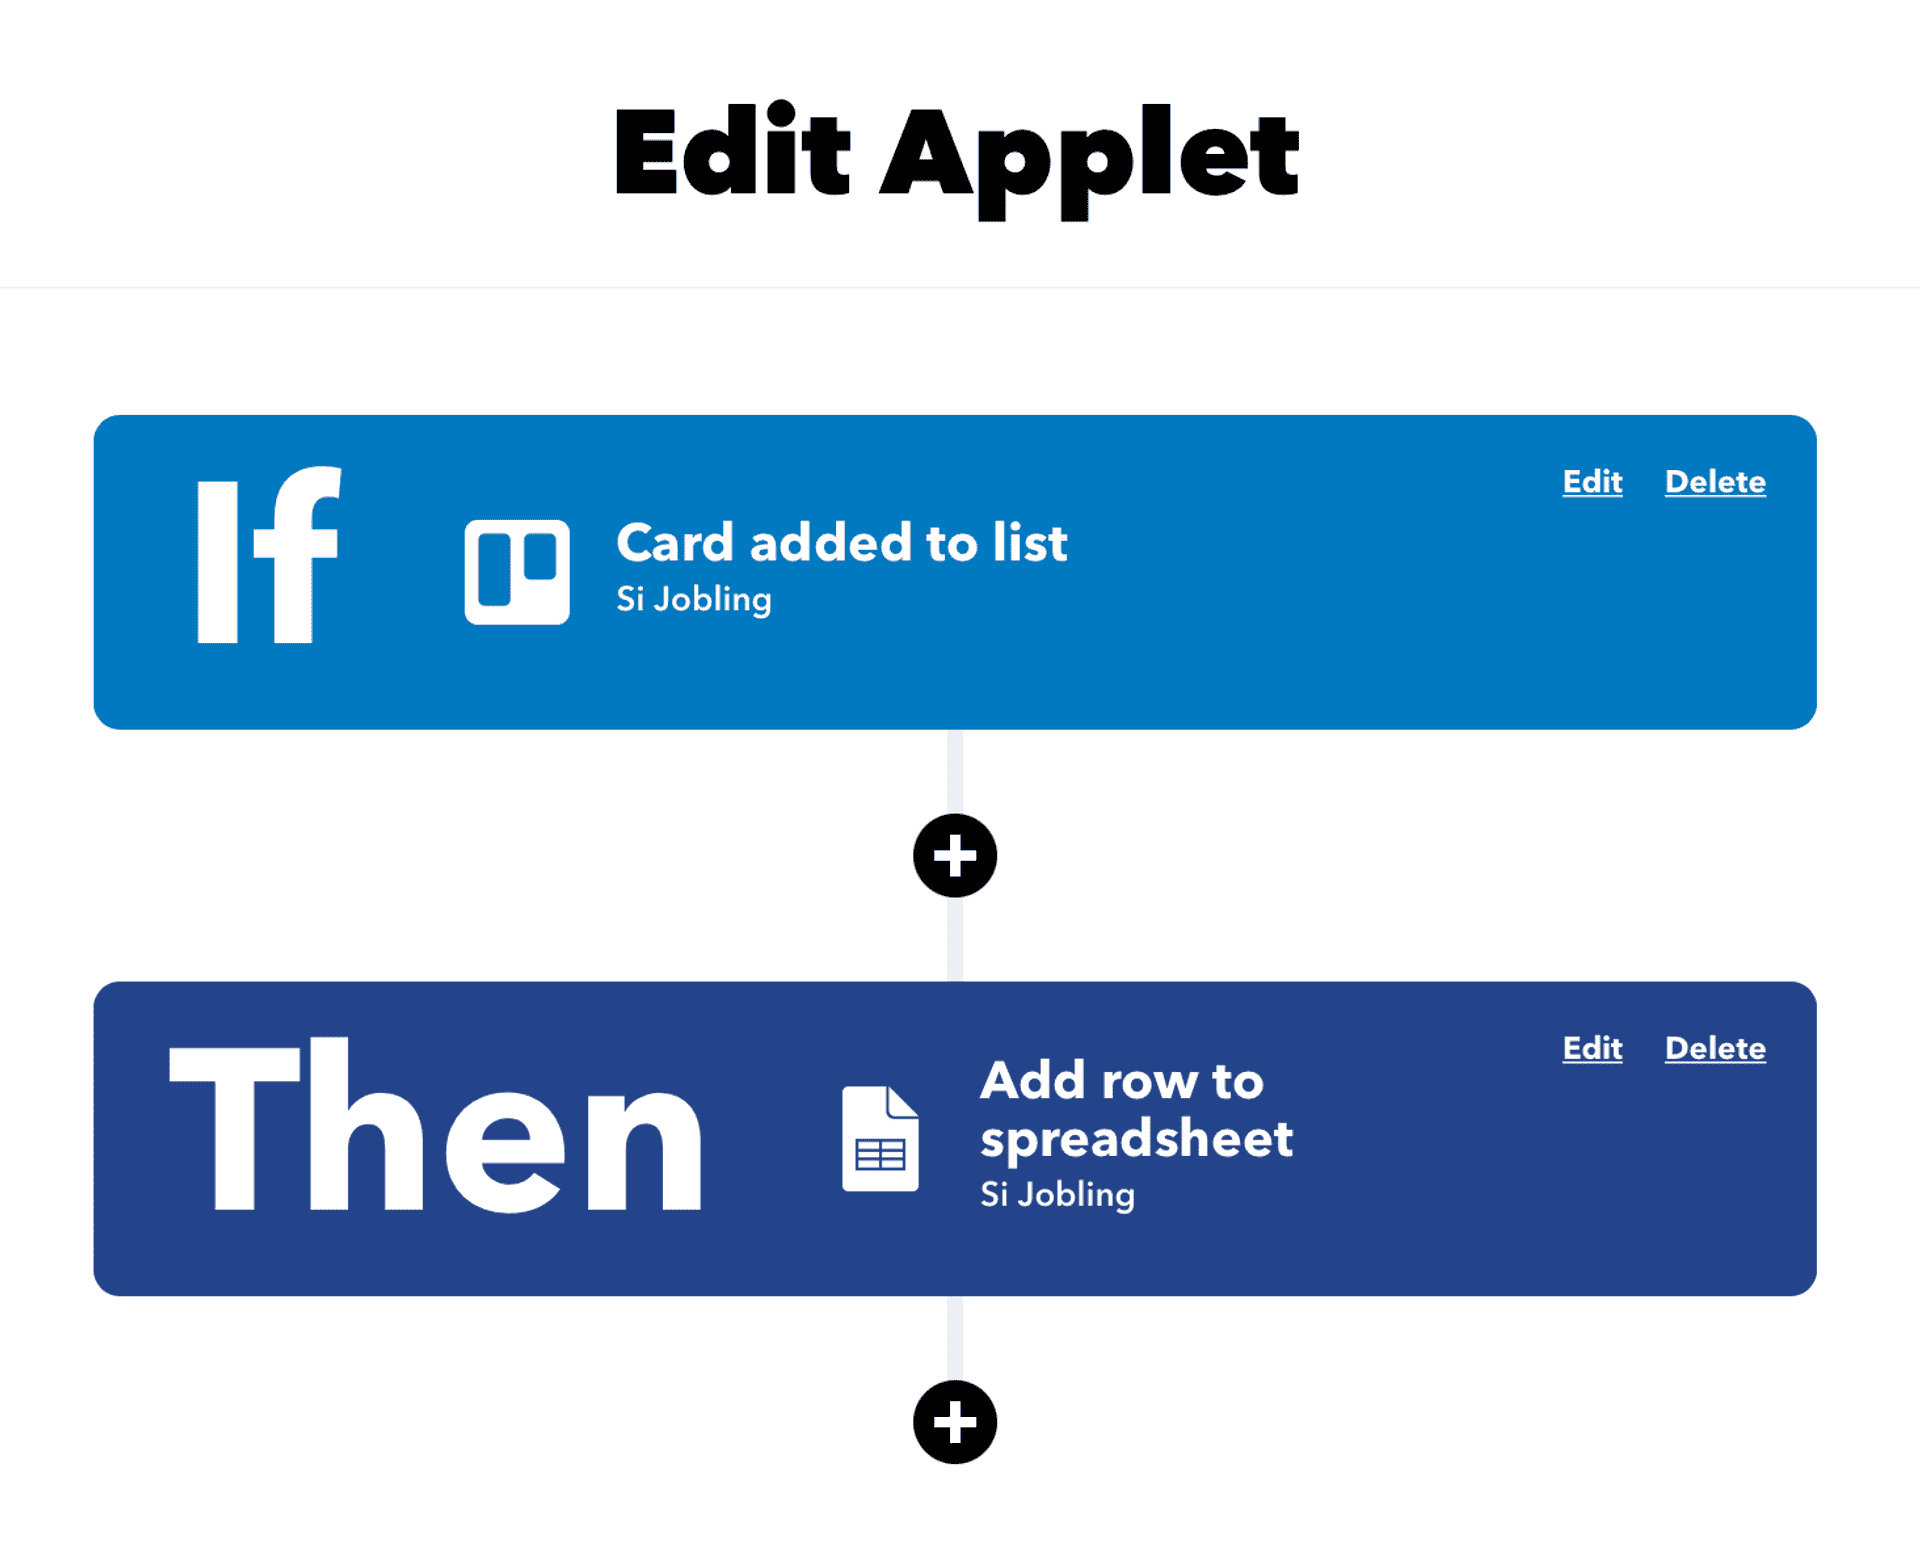
Create your IFTTT account if you haven't already.
Select the Trello service from the IF trigger list and connect your account.
Choose the "Card added to list" event.
Specify the Trello workspace and board then type in the list name as it appears on your Trello board - mine is "Completed 👍".
Now select the "Google Sheet" service from the THEN list and connect your Google account.
Choose the "Add row to spreadsheet" as Event Option.
Specify the Name of your spreadsheet, I called mine "Completed Trello items"
Set the formatted row with the following fields:
||| ||| ||| ||| ||| ||| |||
(The last four fields aren't really necessary but I like to capture those details anyway.)
Set the Driver folder path to IFTTT/Trello/
Save your recipe and enable it.
Time to test the configuration now. Move one of the cards in your Trello board to the completed list and load up your Google Sheet to see if the data comes through correctly.
Strava data with Zapier #
This one might be more niche but let's go through the configuration of a Strava zap to demonstrate how that works with Google Sheets. You can copy my Zap but it's better to build it yourself to understand what's happening.
- Create your free Zapier account if you haven't already
- Create a Zap from the menu
- Search for the "Strava" Trigger and set Trigger Event to "New activity".
- Now you need to authenticate your Strava account with Zapier.
- Once you've done that, fire off the Test Trigger to hopefully see a recent activity from your account
- Now we'll set the Trigger to "Google Sheets" which can be found in the search field and set Action Event to "Create Spreadsheet Row".
- Now connect your Google account with Zapier
- Copy my Strava Template Google Sheet to your own drive, maybe in a "Personal Dash" folder
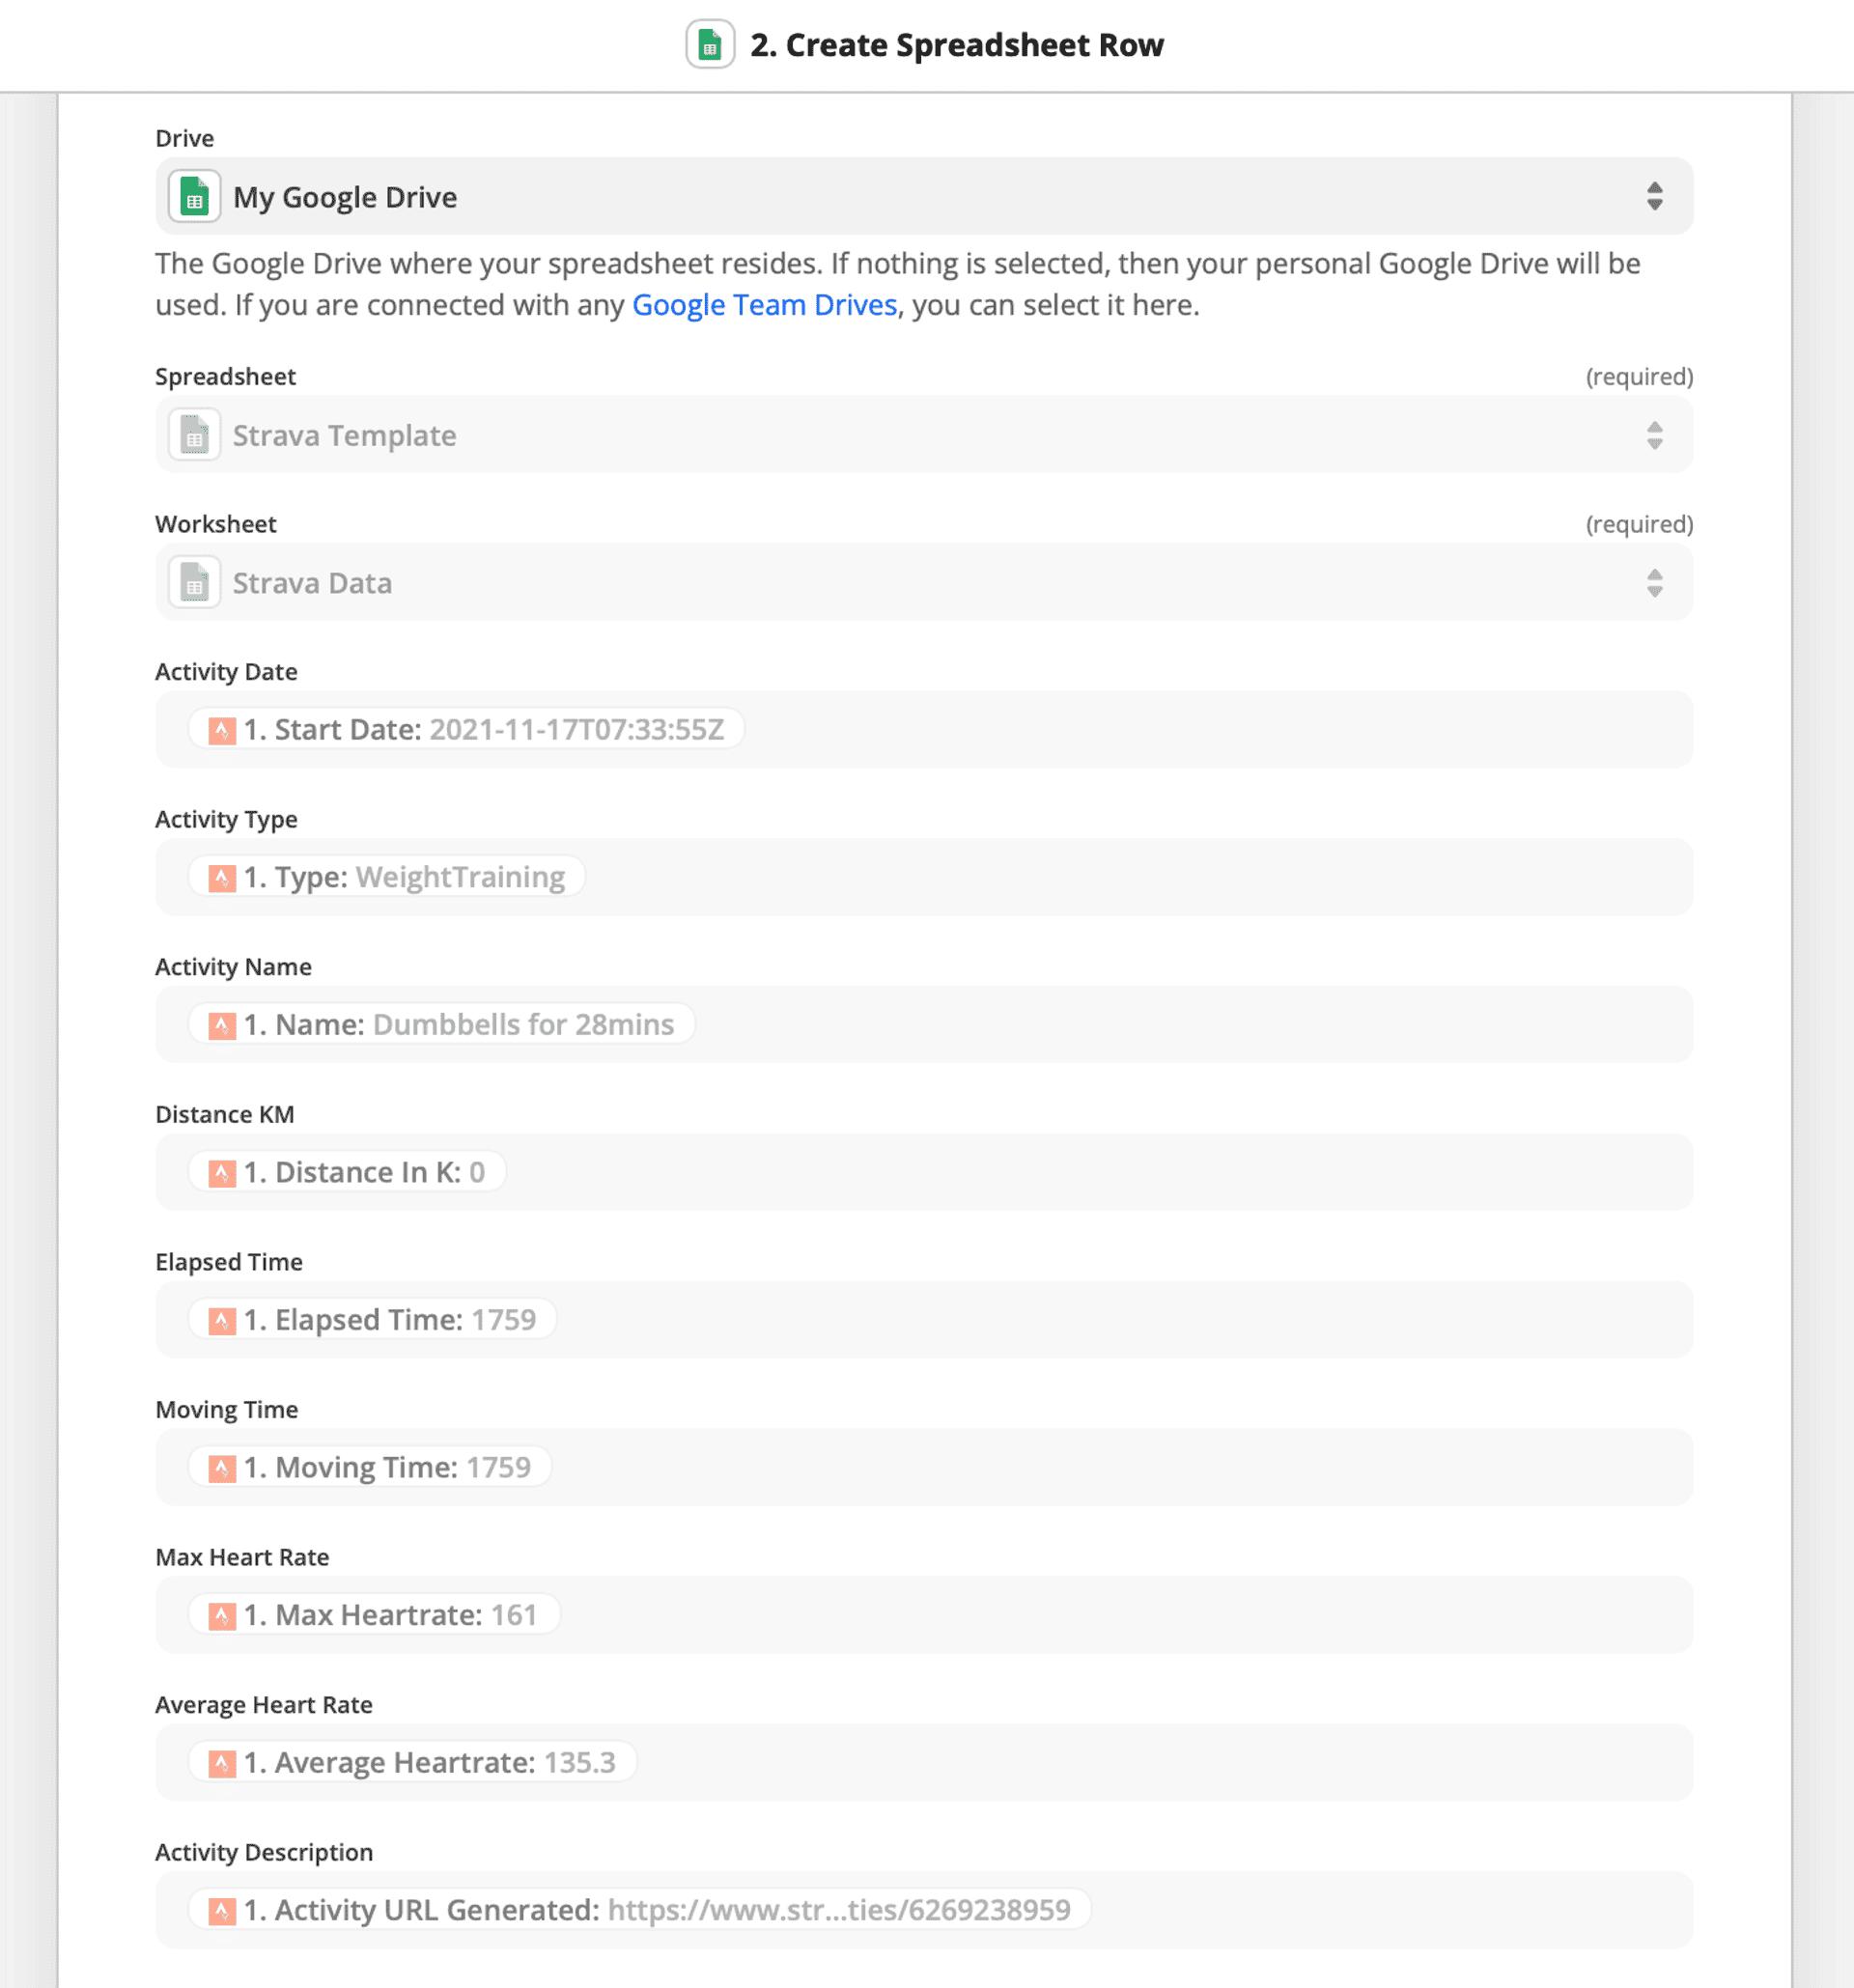
- Select your copy of the file as the Spreadsheet and set the Worksheet to "Strava Data"
- Now we need to map the Strava data to our Worksheet columns:
- Activity Date to
Start Date - Activity Type to
Type - Activity Name to
Name - Distance KM to
Distance in K - Elapsed Time to
Elapsed Time - Moving Time to
Moving Time - Max Heart Rate to
Max Heartrate - Average Heart Rate to
Average Heartrate - Activity Description to
Activity URL Generated
- Hit Continue to save your configuration.
- Time to test it - hit the Test & Review button under the preview text and check your Google Sheet for a new row of data.
- Remember to name your Zap to something like "Strava activity to Google Sheet" and hit Turn On Zap.
Visualising in Google Sheets #
Now, let's setup some PivotTables and charts to visualise your data. First up, we're going to get a split of workout types from our Strava data.
- Highlight the first two columns "Activity Date" and "Activity Type" of your Strava data sheet (A:B) then from the menu, select Insert > PivotTable
- On the "Create pivot table" modal, select New sheet
- Google has a good stab at suggesting suitable data sets but we'll do this manually.
- In the Rows section, add the "Activity Type" field
- In the Values section, add "Activity Date"
- Make sure it's Summarised by "COUNTA"
- I also like to order by the largest count so, in the rows section, change the Order to "Descending" and Sort by "COUNTA of Activity Date". Deselect "Show totals" as well.
- With the data now organised, let's create a pie chart. Select both columns (A:B) and from the menu, Insert > Chart.
- On the Chart Editor menu, choose "Doughnut chart" from the Chart type dropdown
- You can now tweak the appearance under the Style tab of the Chart Editor.
- Set a suitable Chart title to "Workout type split"
- Under the Pie chart section, set Slice label to Value, increase Label font size to 30, set Text colour to white and bold.
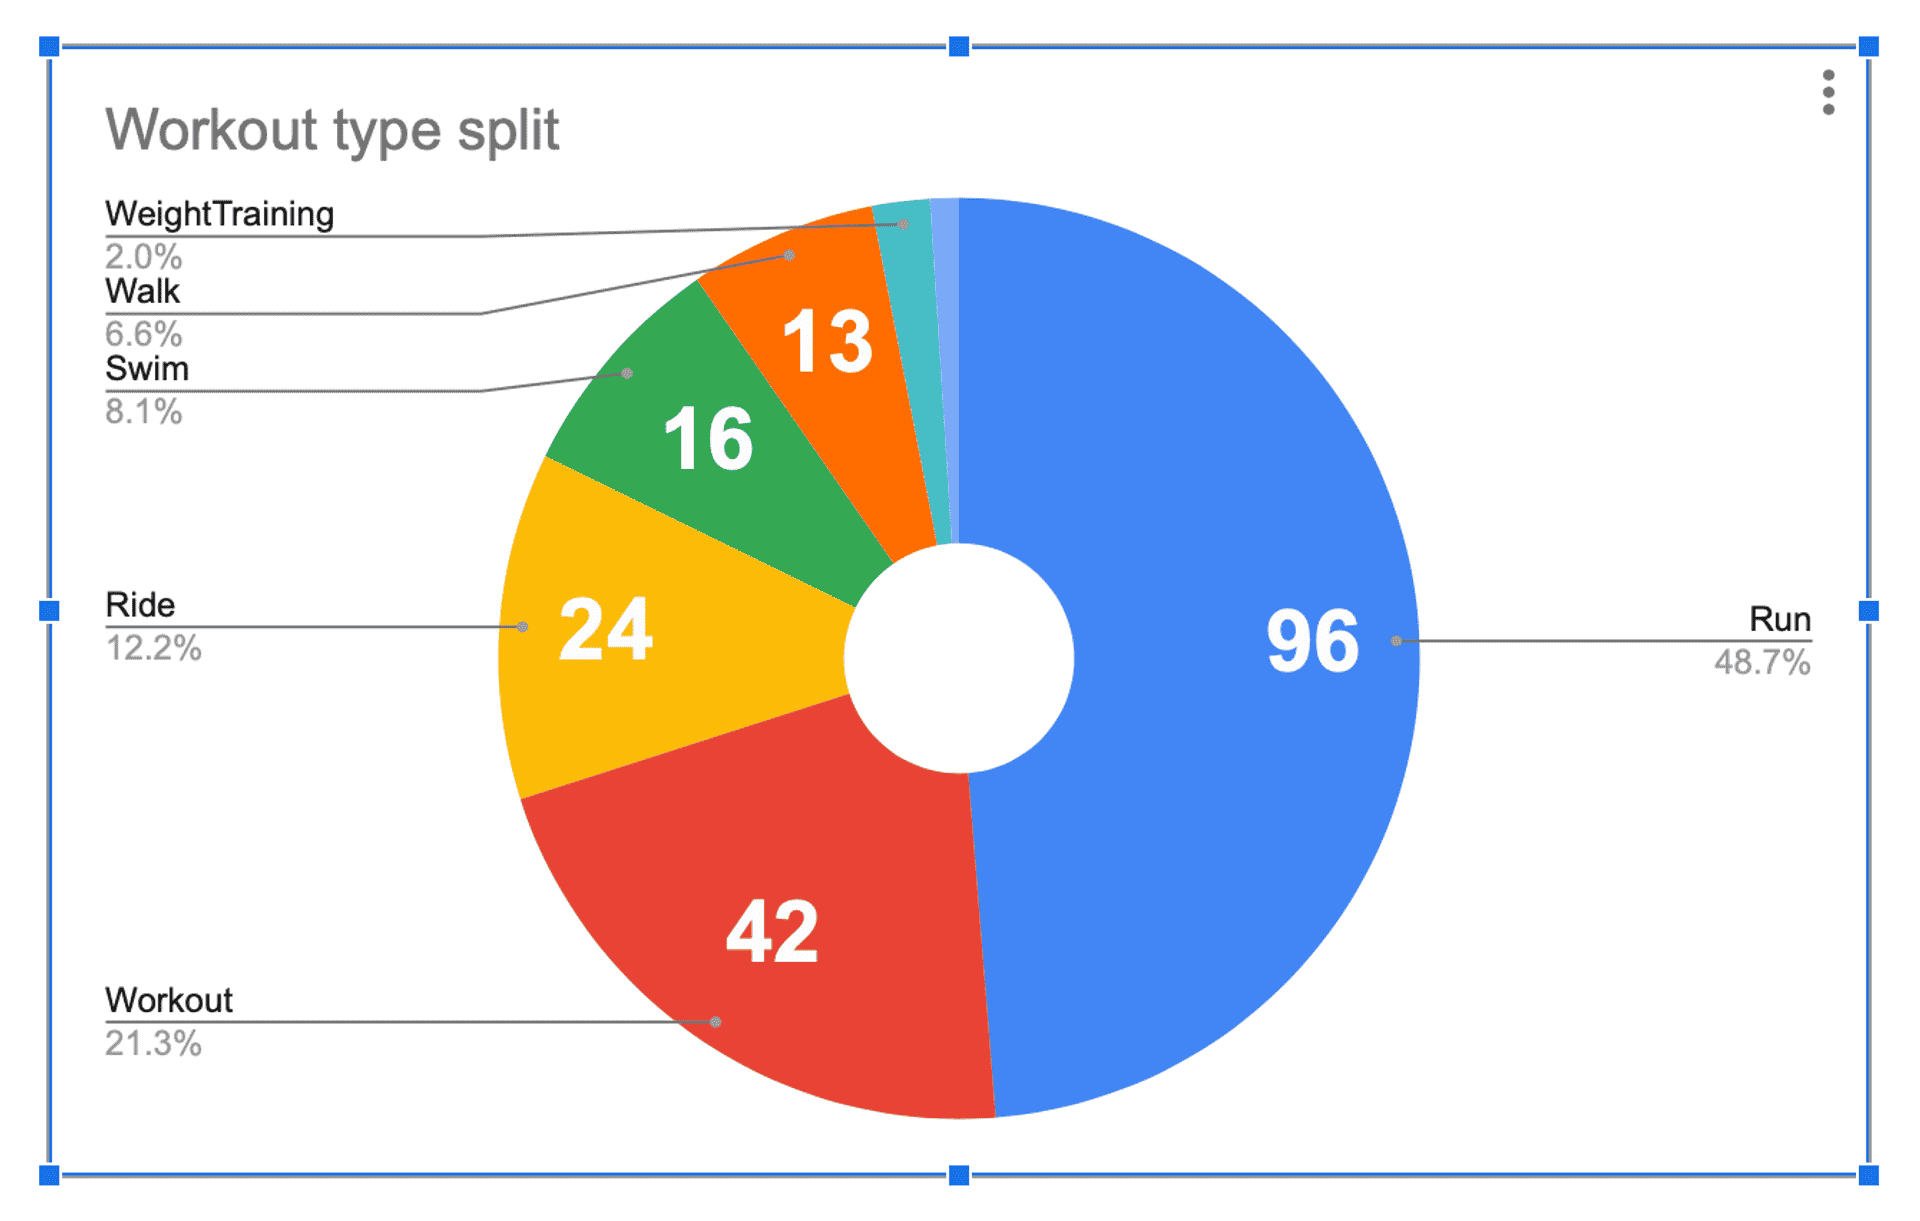
Plenty running activities
Now let's break down our completed Trello data on a daily basis. First, we need to parse the completed date/time stamp from IFTTT to a readable data format. For this, we'll use some regular expressions with the =DATEVALUE function.
- In your Trello "Completed items" sheet, create a new column at the end of your sheet.
- On the second row (beneath your column headers), add the following formula where A2:A is your column of date and time:
=ArrayFormula(IF(ISBLANK(A2:A),,DATEVALUE(REGEXREPLACE(A2:A,"at","")))) - This will get the date before "at" in the string and parse to a date value. The
ArrayFormula will repeat the function on all following rows and ISBLANK will only parse it when text is available. - Now, select your new column of dates (column I for me), select Insert > Pivot Table from the menu and create a new sheet.
- In the Pivot table editor, select your new "Date" column in the Rows section and set the Order to Descending.
- In the Values section, add the "Date" column again and Summarise by "COUNTA".
- You should now have a break down of completed items by date.
- To remove any empty date rows, create a Filter with the Date column, change Status to "Filter by Condition > Is not empty" and hit OK.
- You can also apply some date-based groupings to your date (such as monthly) by right-clicking the first column of your pivot table and select Create pivot date group > Year-month.
- To show a counter chart of the latest daily count compared to the previous date, select the first row count (cell B2) and select Insert > Chart.
- Choose Scorecard from the Chart Type dropdown and make sure COUNTA of Date is set to the Key Value.
- To show a difference on the previous date, in the Baseline Value dropdown, select the grid on the right, highlight the first two rows of counts (B2:B3) and hit OK.

A bad day of Trello items
What's next? #
This is an ongoing side project which is constantly growing and refined based on new habits I want to track against life goals. I'd highly encourage you to experiment with these mechanisms to track your personal habits, whether they're in Trello and Strava or other online apps. You'd be surprised how easy it is to get that data out of the apps into your own (Google) hands for archives and analysis.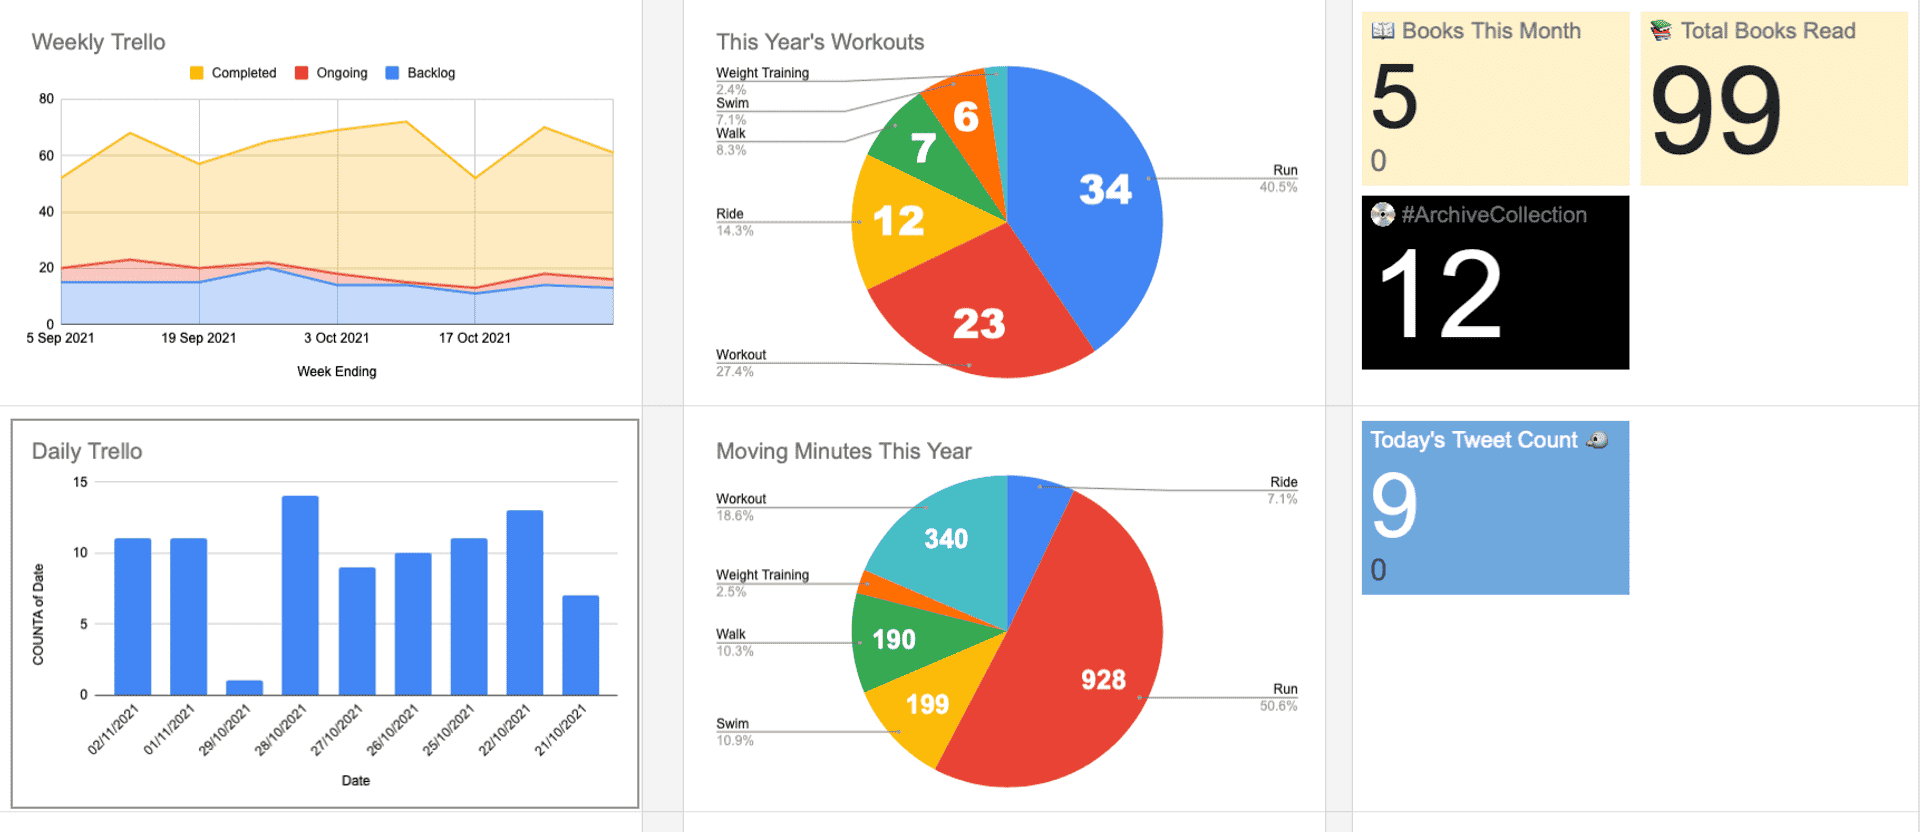
Snapshot of the Dashboard
I'll follow up on this in the future with further improvements. I'd like to build a more dedicated app that uses the Google Sheets data in a user-friendly web UI, especially with a mobile friendly experience as the current Dashboard is only optimised for large screens and the ability to customise for personalised needs – a possible side project for 2022…